Basic Visualization Using ParaView
Section authors: Matthias Gsell and Elias Karabelas
ParaView is an open source application for interactive and scientific visualization and it is available for several platforms (Linux, Windows, Mac OS). Paraview is built on top of the Visualization Toolkit (VTK) libraries.
Installation
Go to the ParaView homepage and choose your platform.
LinuxFor Linux systems just download the archive file and extract its contents. Then run
      cd /PARAVIEW/PATH/bin
./paraview-
WindowsFor Windows systems download the installer and run it! After the installation finished, run Paraview by clicking on the Paraview icon. -
Max OSNo idea at all!
Overview
After a successful installation and after you managed to run ParaView, you may load data sets to visualize. The standard file format is the VTK file format. A detailed user guide is available as pdf. In the following only a few of the most basic operations are illustrated.

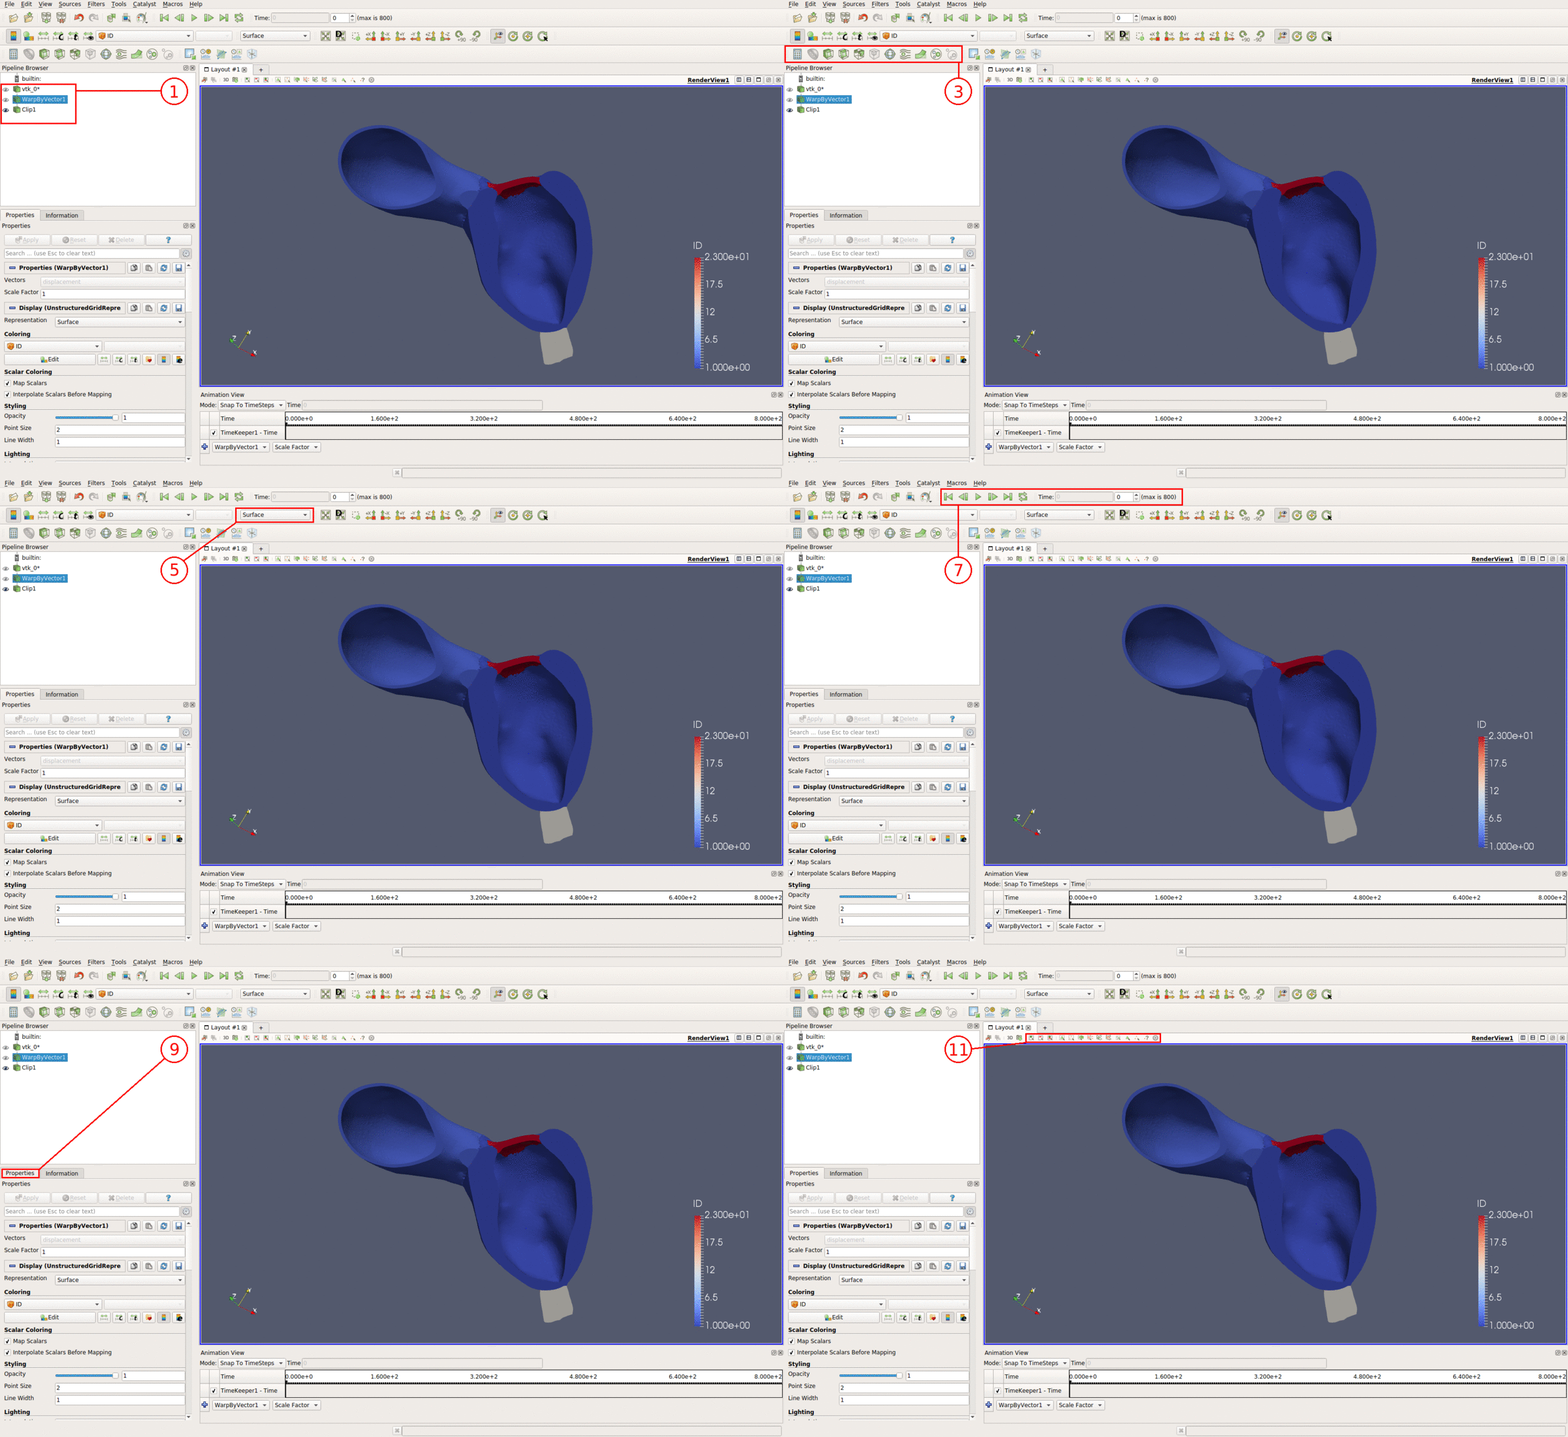
- Data Sets and Filters: List of all data sets and filters, toggle visibility by clicking on the eye icon next to the data set / filter.
- Pipeline Browser: The pipline browser summarizes all the used data.
- Common Filters: In this toolbar you can find the most commonly used filters in ParaView. They include (from left to right): Calculator, Isosurfaces, Clipping, Slicing, Thresholding, Subset Extraction, Glyphs, Streamlines, Wraping, Dataset Grouping, and Level Extraction.
- Active Variable Controls:
- Representation Toolbars:
- Camera Controls:
- VCR Controls and Current Time Controls:
- Filters:
- Properties:
- Animation View:
- Selection Tools:
Filters
To process data, a broad variety of filters is available. In the following we want to explain the most important of them.
Calculator
This filter is rather useful for postprocessing data. For example when you want to calculate the total pressure for some CFD data \(p_\text{tot} = p + \frac{\rho}{2}\mathbf v \cdot \mathbf v\).

- Here you find listed some build in mathematical expression. The buttons labled
iHat,jHat,kHatdenote x,y,z coordinate vectors (if you want to build together a vector valued function of your own. - You can switch here for a nodal based result or a cell based result
- Here you chose from your loaded data. Can either be nodal based or cell based
For real Python-Afficiniados there is also a Python extension of this calculator to directly manipulate the data arrays.
Cell Data To Point Data: Map cell data to point data on unstructured data sets.Clip: Clip the data set.Contour: Draw contour surfaces.Extract Selection: Extract selected points or elements.Glyph: Draw glyphs for a vector valued data set.Gradient Of Unstructured DataSet: Compute the gradient for a unstructured data set.Iso Volume: Draw the volumePoint Data To Cell Data: Map point data to cell data on unstructured data sets.Slice: Slice the data set.Stream Tracer: Draw streams for a vector valued data set.Threshold:Warp By Scalar: Warp geometry by scalar data set.Warp By Vector: Warp geometry by vector valued data set.